Create a gradient background for Power BI

Diving deep into data transformation, modeling, and analytics, visualization has traditionally been my Achilles’ heel. Nevertheless, I’m ardently working to enhance this skill!
A universal principle that is especially pertinent to reports and data visualization is: simplicity is key. Overcomplicating with excessive frills isn’t necessary; straightforwardness often wins the day.
In my visual designs, I opt for a minimalist color palette and limit the number of visuals, ensuring that users can easily grasp the content presented on a page.
Gradient background

But when it’s time to add some unuseful stuff to our report, what I like the most is to add a gradient background. No need to add a flashy color variation!! I like to switch between one color and his very close variation. Like a “middle blue” to a “dark blue”.
Many Power BI blogs mention PowerPoint to create a gradient background. And indeed, it’s not that a bad idea. But for some reason, PowerPoint generates images with a very ugly layer. (Like a rainbow)
I only have this issue when I publish my report on Power BI Services, but not on Power BI Desktop. (Is it related to my 4K screen or compression? No idea)
But if you encounter the same issue, or if you want to learn another way to do it, I’m explaining here how to do it with Paint .net.
Paint.net
Paint .net is my favorite images/graphics editor. It’s free, contains almost everything I need, and is not too complex to understand.
You can download it here https://www.dotpdn.com/downloads/pdn.html
How to create a gradient image with paint.net
Open Paint .net application and create a new canvas. (I recommend you to keep the same size as you use in your Power BI)
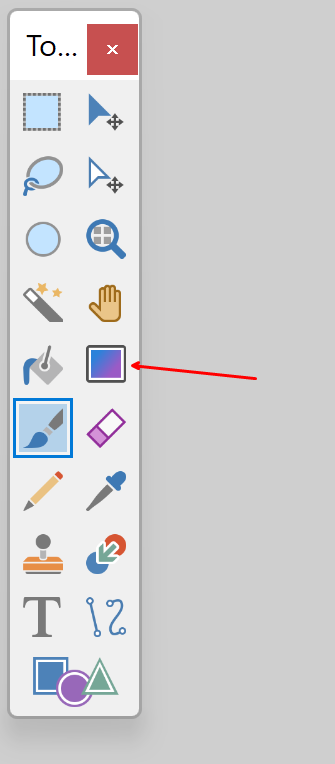
In the toolbox, choose the Gradient tool
Now that the gradient tool is selected, go to the Colors pane and click "More"
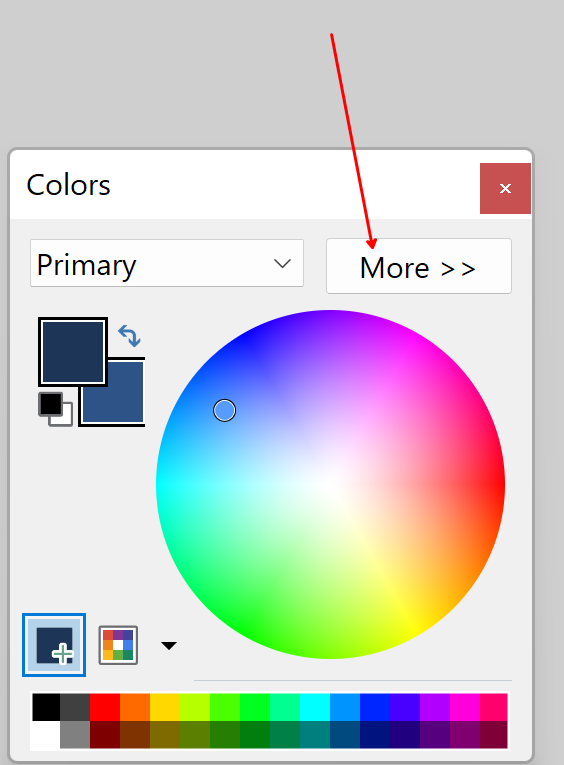
First, you have to select a "Primary" Color. It's the one selected by default, but you can select it by using the dropdown list and chose "Primary" or by click the square on the top.
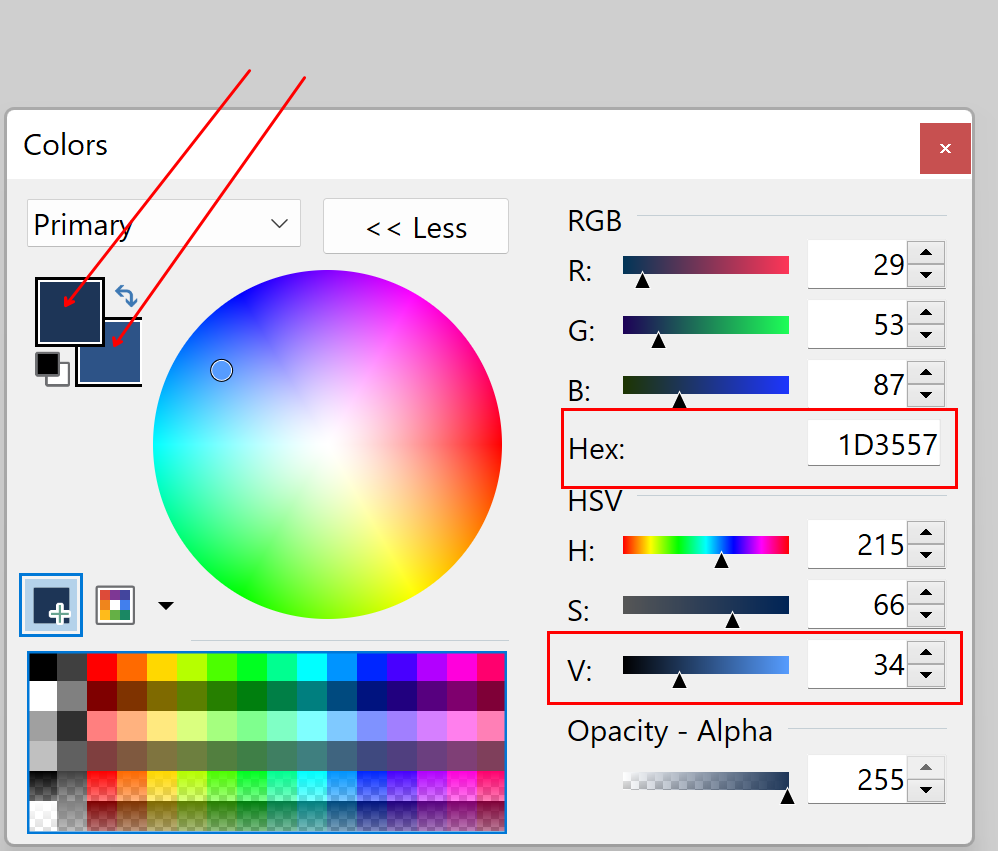
Use the color picker or paste an Hexadecimal RGB value. (I highly recommend you to use it)
You can find interesting color on https://coolors.co/palettes/trending
When it's done, select the "Secondary" color. I usually paste the same color as the primary but change the "V" slider to a more lighter value (but very close)
Go to your canvas and click on the left button of your mouse, drag the cursor and release the button.

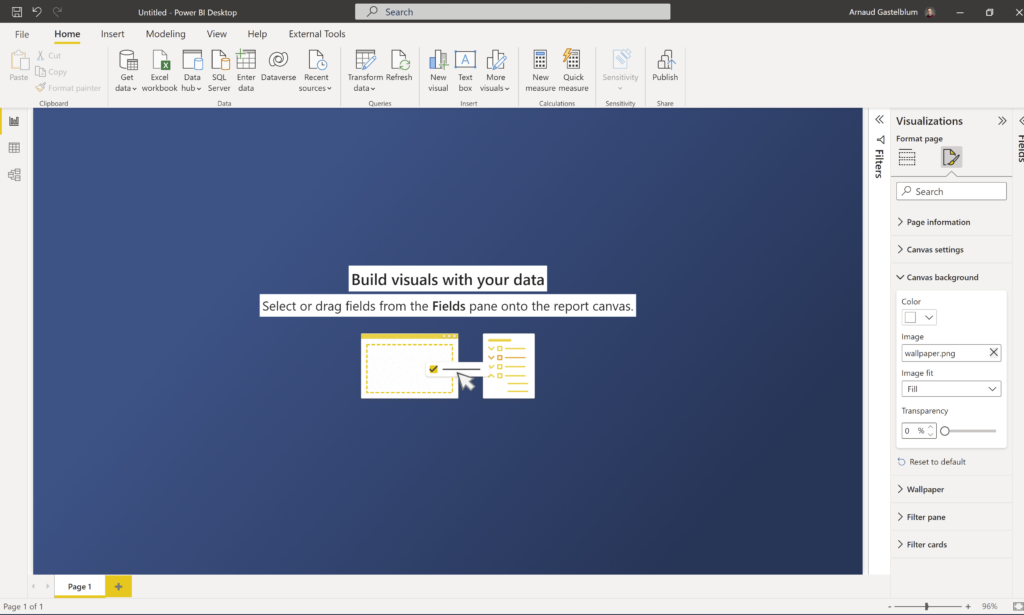
Save this image into a .png file and use it in Power BI Desktop.