Power BI - Your model matters
I’m trying to address a crucial topic (to me), but more complex to communicate than a technical feature.
This article gives you some tips and may give you the urge to look differently at your data. If so, my bet will be won, and you may significantly improve your Power BI trip. Exciting, right?

Introduction
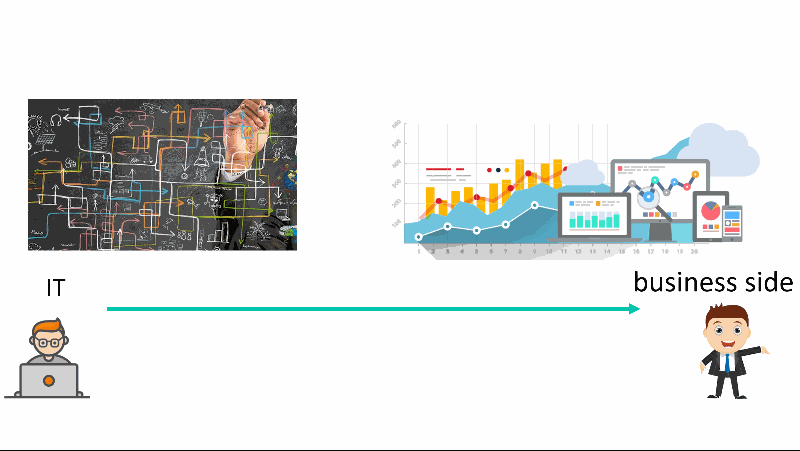
Power BI is a fabulous tool that allows us to bring together the technical world of developers and end-users.
- For a developer, it allows us to create beautiful visualizations and highlight the data easily.
- For business users, it simplifies the technical work to focus mainly on the result.
Having worked at several clients, I am amazed by what users initially “non-technical” can achieve! Users quickly become skilled in the tool, but sometimes lack a little methodology. A habit, unfortunately quite common, is to multiply the models and then duplicate the data. A question, a report corresponds to a data model. This is not always the case, but it’s quite often what I saw.
Several positive points to this:
- Speed of implementation
- The size of the model reduced to the report need (Small size).
- It does the work!!
But also, problems:
- Duplicate data
- Several different models and different logics/relations. Risk of having different results from one model to another.
- Several models, more maintenance
As a BI developer, where the situation allows, I am a staunch defender of the unique model. With other Microsoft technologies, SSIS - SQL Server - SSAS Tabular / Multidim, we are trying to create what is called a Datawarehouse. There are several methodologies for modeling this datawarehouse, but I will not dwell on it in this article.
A Datawarehouse is a data model that makes it easy to store, access, and understand your data.
Load Before, Think After
Two worlds existed and still exist.
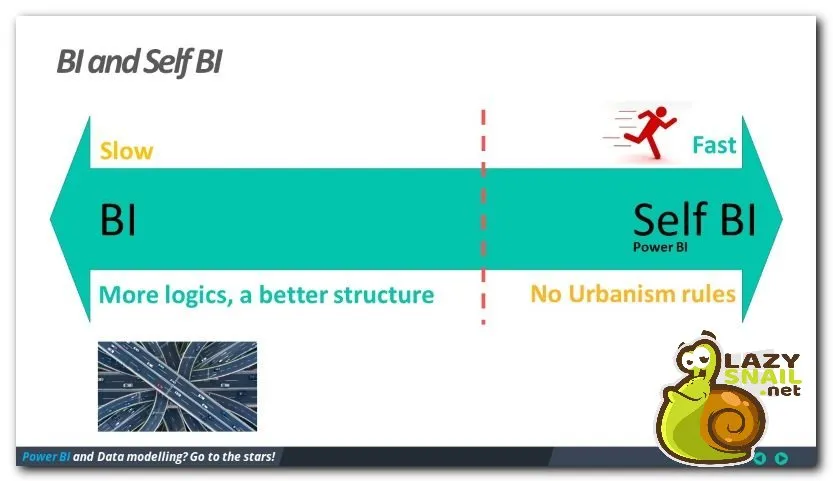
BI (Developers / IT Service)
Let’s talk about me since that was the case. I juggled from one project to another by managing the business part as management of apple or pear. I did not bring much interest to the job or the nature of the data. Could I reproduce the reports asked? Yes! And I think everyone was happy like that. Complex SQL queries, performance, calculations, rules implementation were my main concerns. I was the perfect example of developer 1.0.
Self BI (Users / Business)
The users I met have very different technical knowledge.
- They have no particular interests or are panicked by the sources and structure of the data at their disposal.
- They are obviously in a hurry to provide the reports fairly quickly
For all the reasons mentioned, when creating a new report, users are eager to load the data as is. For both “worlds” the imperatives are:
- Load the source data.
- Provide a table or calculation as needed.
Methodologies (Quick Win)
Without going into the details of the modeling of a Datawarehouse and, more precisely, the Kimball method, I want to dwell on two tips.
Denormalization
Brainstorming
The next two topics require the first change in your habits. Do not keep the source tables as they are in your model When you load your data into Power BI, you can make several changes in the Query Builder. In addition to data typing, conditions, it is essential to consolidate the data. This is the perfect introduction for Denormalization.
Denormalization
Normalization / Denormalization ?
In computer science, we tend to standardize information.
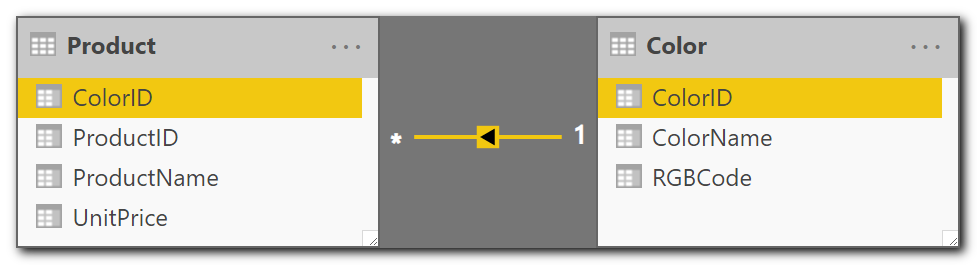
An example will be more concrete than a definition: A product is available with a color. A Color entity will be created and will contain all available colors. In the source system, a drop-down list allow the user to pick up a color. Often the main table retains a key (foreign key) that references the other table. This way of exploding the model into multiple tables is called “normalization”.
For our reporting needs, we have to backtrack and consolidate information into fewer tables.
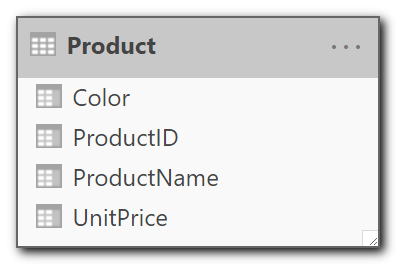
If we denormalize, our example could looks like this simple table.
- Simple for your users
- Simple for your model
- Simple for your DAX measures
Concrete example
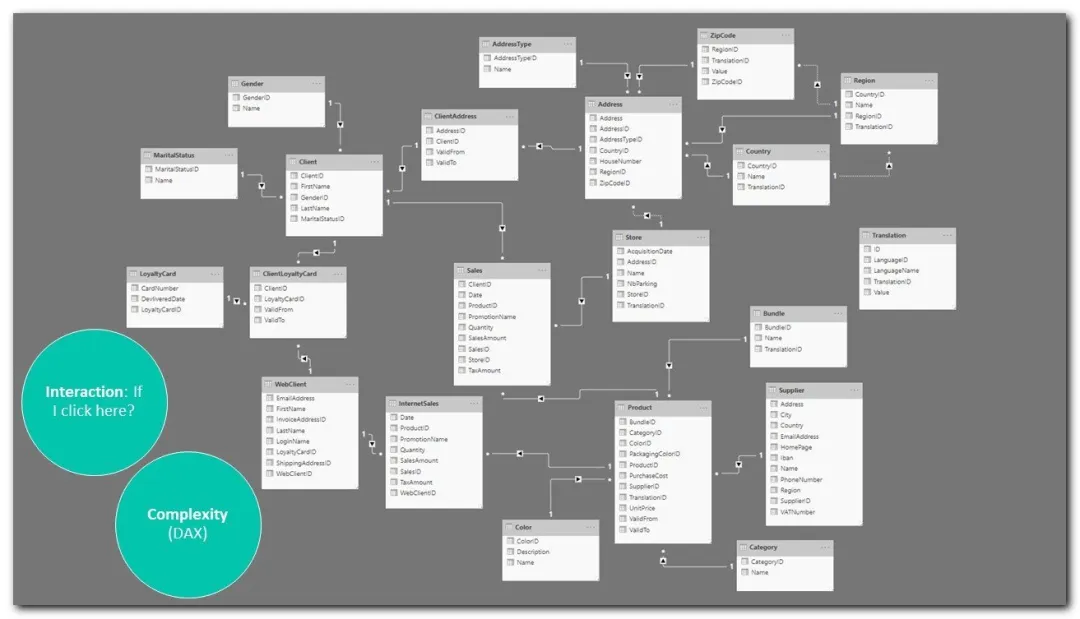
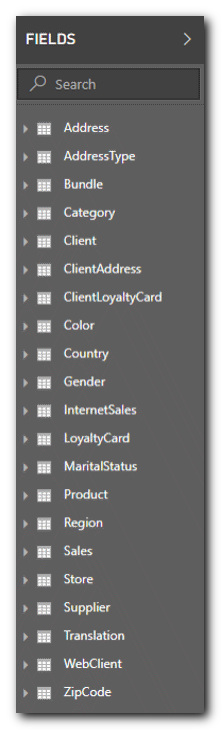
In this example, Bill tooks all the tables and files from his source system. He decided to load the table as is, without any changes. It was easy for him and he knows very well his model. But his users came back to him with a ton of question regarding interactions. Which tables will be impacted if they filter one specific attribute. They were not really sure. Since they have the “Sales Person” in their model, they wanted to know if Gender or Marital Status were link to “Sales Person” or “Client”. (So bill, renamed it to make it clear)
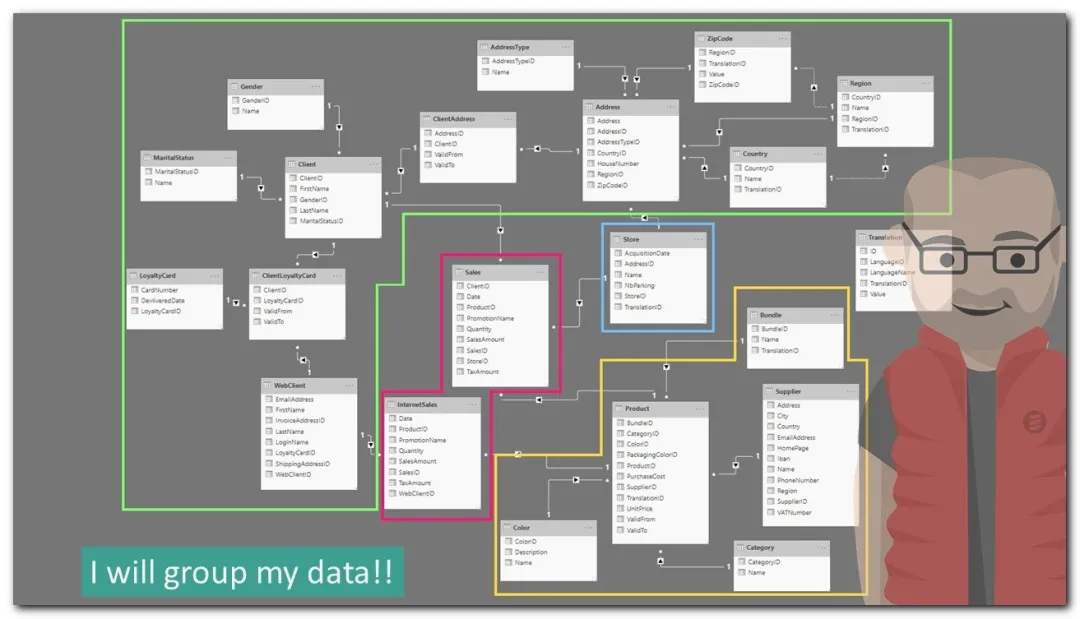
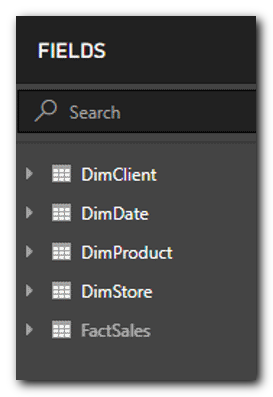
One day Bill wakes up with a giant smile! Is it because his favorite TV show is scheduled today? Not only! He has an idea… And a straightforward one. He decided to group his data into fewer tables. (When there is no many to many relationships). His work life changes to better!
- Less complex DAX expression
- More understandable datasets
- Less support and more time to watch his TV show. (Yes, both are compatible!)
Brainstorming
The title should perhaps have been: Do not keep the focus on the technical problems but think of yourself. We all tend to want technical challenges, it’s addictive, and it gives us the impression of moving forward! In our Professional world, Power BI is the equivalent of Candy Crush! But I have more pleasure in aligning beautiful DAX measures in a table than sweets, do not you? For this point, I invite you to step back and step against our technical world.
Ask yourself the following questions: (or ask them to your users)
- What is the nature of your work? Describe it to me.
- What are you doing within the company?
- What indicators and reports do you consult?
Take note of the information in the form of keywords and mention the frequency. Some words will stand out and can be likened to what we will call later “Dimensions”.
My advice: Take a pen, paper, coffee, soft music. Disconnect from your computers, technical “worries”. Make sure your explanations can be understood by your wife, your husband, your friends, your sports coach, your children … and yourself …

Your notes could look like this word cloud.
See if some words do not relate to each other through an idea or logic.
For example,[Customer Code] and [Customer Name] could be grouped under the same “Customer” dimension. (While these are potentially in two different tables or source files) The watchword here is: DO NOT THINK TO THE TECHNICAL ASPECTS. Without knowing it, you imagine the data model dreamed for you and your users. It fits your needs, your business, and does not care (yet) about the complexity needed for the data transformation! In this model, an end-user will find it much more comfortable and can even build their reports. Attributes will be displayed, grouped by logical ideas, and will facilitate reporting. The attractiveness of Power BI and BI Self-Service, in general, will not only be available to you, but it will also be accessible to end-users. Now that you’ve sketched out your dimensions, you can link them together. You certainly have information that expresses an event with measurable data. (Additive data) For example:
- A sale with a price, a quantity.
- An inscription with a volume, a frequency.
The relationships mentioned above correspond to Facts. A fact table is defined by its grain, which is itself determined by the list of dimensions attached to it.
The sale is made:
- By a customer
- For a product
- In a store
- On a given date
- With a means of payment
The inscription bears:
- On a magazine
- By a subscriber
- For delivery to a specific address
- With a subscription end date
A brainstorming session can quickly give you a good overview of your next dataset.
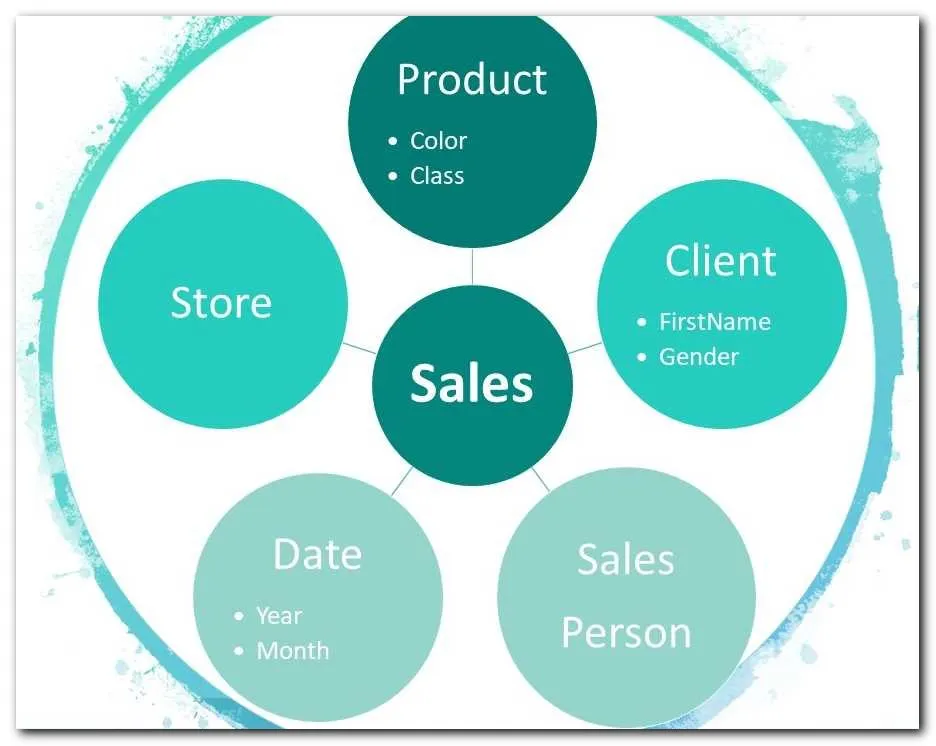
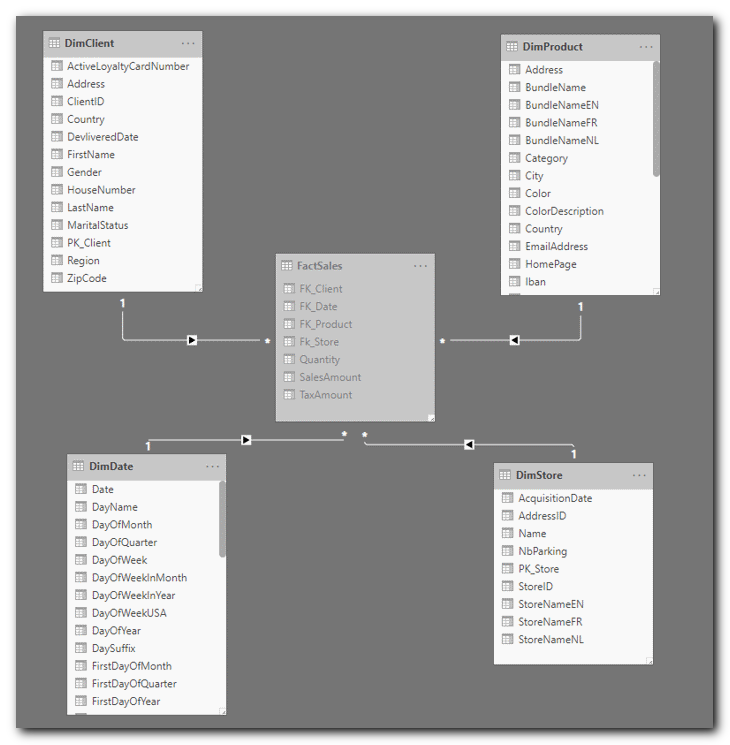
Your fact table is in the middle and dimensions around. Where is the technical complexity for your users? For your DAX measures? Your users can now keep the focus on their results and to the more complicated question: Do I really avoid to use a Pie Chart ;) You can now look in detail how you will load your dimensions. Dimension by dimension asks you the question: Which is the grain of my dimension? Household, client, client history? And now start your candy crush session, load your data, and play a lot in the query Builder / SQL / … more … And do not forget to enjoy it, our work is exciting!
How to put all this into music
Power BI gives you the ability to consolidate your data into the Query Builder. (Power Query for the intimate) Do not minimize the time spent in this step, it will save you a lot later. You will be able:
- Group your data (multiple source tables can be grouped) into a single table.
- Clean up your data. (Filter unnecessary data, edit poorly formatted data) This step will provide more convenience to your users.
- Add a type to your data.
The interface is quite complete and allows you to perform all the desired fantasies. For performance reasons or more flexibility, you can achieve your work on data with SQL queries. I do not have doubts about your technical abilities to perform this task.
Take a step back on your technical problems, and nothing stops you! Take the time to rediscover your craft with an outside look! Power BI offers you the technical means to achieve this. And with a little methodology, you’re entering the big family of Datawarehouse’s happy modelers.
More infos:
https://en.wikipedia.org/wiki/Dimensional_modeling https://docs.microsoft.com/en-us/power-bi/guidance/star-schema https://en.wikipedia.org/wiki/Dimensional_modeling https://en.wikipedia.org/wiki/Data_warehouse#Dimensional_versus_normalized_approach_for_storage_of_data https://www.sqlbi.com/articles/the-importance-of-star-schemas-in-power-bi/ https://radacad.com/power-bi-basics-of-modeling-star-schema-and-how-to-build-it